- January 2018 - December 2022
- Santaella, Córdoba (Spain)
- Ascending & Descending
- Sentinel-1
- Embankments
InSAR technology has made it possible to characterize the historical evolution of the deformation of the layout and slopes in a section of more than 27 km of the High Speed Railway (AVE) line passing through Santaella (Córdoba). A high density of points has been obtained in the analyzed area. The work has allowed us to identify the sections of the route with more accumulated deformation as well as to characterize the historical behavior of all the slopes. In this case we focus on the analysis of the behavior of two of these slopes. From the two satellite geometries (ascending and descending) we have obtained the vertical movements and East-West planimetry. Thanks to the 2D time series clustering tools of Detektia, areas of homogeneous deformation behavior have been identified.
The following figure shows the average strain rates in what is called LOS (satellite line of sight) in upward and downward geometry for the analyzed period (in this case from January 2018 to December 2022).
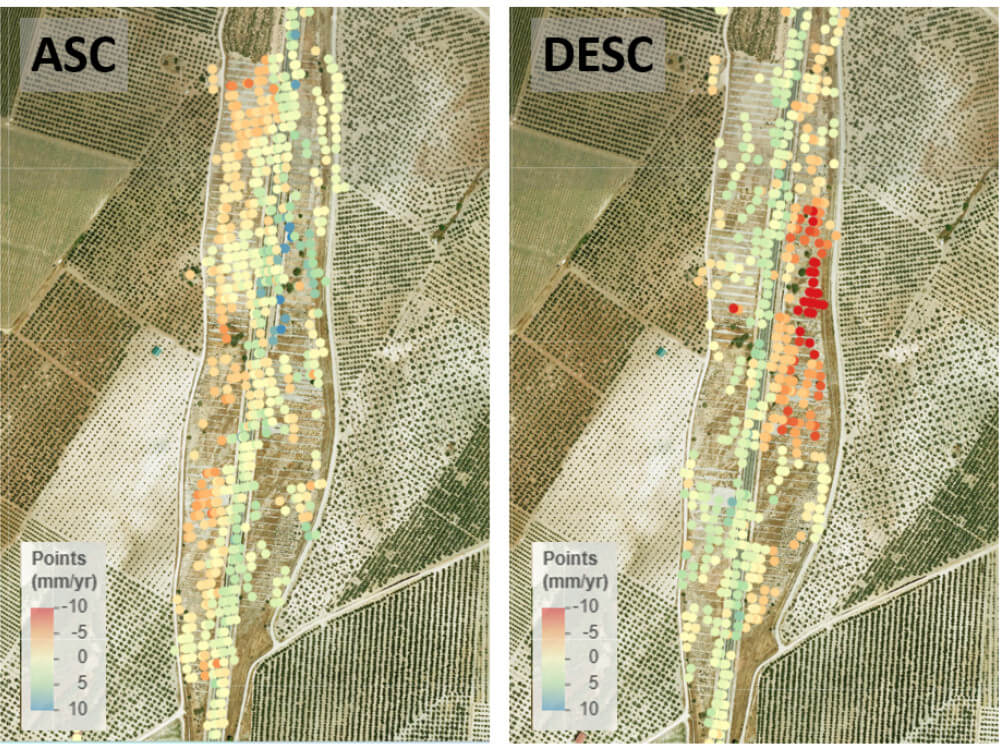
In satellite geometry we can already identify the most active areas of the slope, we observe areas that behave differently in upward geometry than in downward geometry, which surely indicates, as we will see later, movements in planimetry.
The time series of deformation in specific areas of the slope show the time evolution of deformation in upward LOS and downward LOS. We see in which periods the deformation accelerates or slows down in satellite geometry.
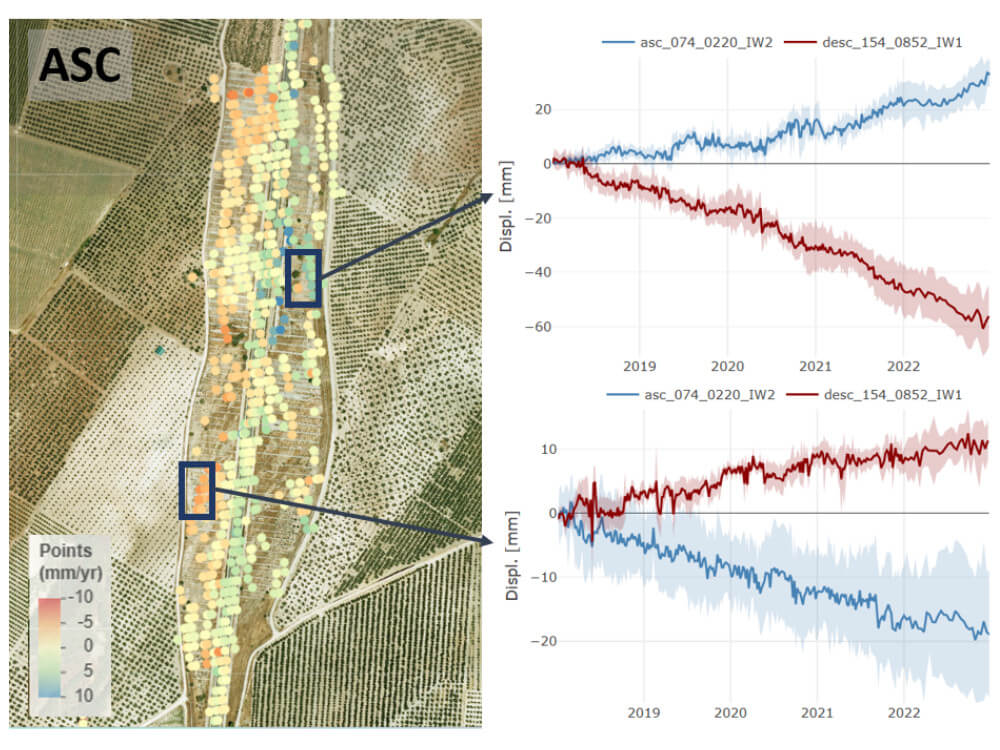
Even so, it is complicated to analyze in depth the behavior of these slopes on axes where we are not used to.
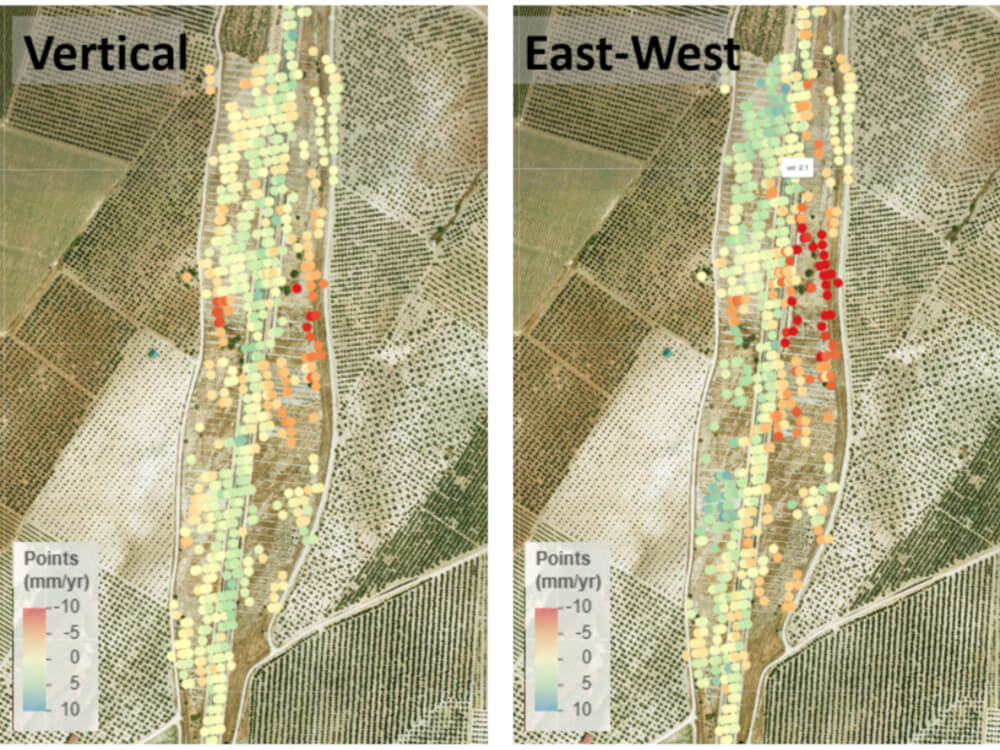
From the movements in satellite geometry (ascending and descending), we estimate using Detektia decomposition tools, the time series of vertical deformation and East-West planimetry.
The following image shows the InSAR point cloud colored with the mean strain rate but now in vertical and planimetry, axes that we understand much better.
As before, we can analyze the evolution of deformation, this time vertically and planimetrically, in some specific areas of the slope.

The decomposition of movements facilitates the interpretation of the slope behavior. The area above in the previous figure (slope located east of the track) has movement both in planimetry and vertically (settlement) with the movement in planimetry being much more pronounced.
The area below in the previous figure (slope located to the West of the track) has hardly any movement in the vertical axis but a clear displacement to the East (more than 2 cm of average accumulated displacement in the analyzed period).
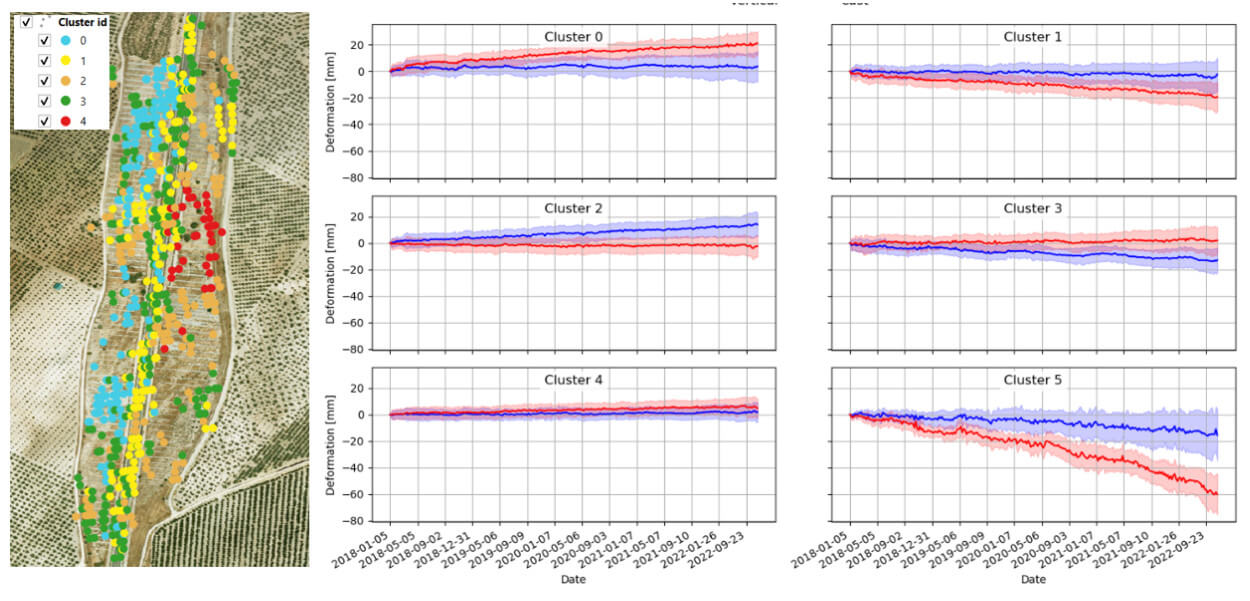
Detektia tools have allowed grouping points with similar behavior both in vertical and planimetry.
The following image shows the result of the grouping, we can see how each of the clusters behaves and where they are located in space. This tool allows us to differentiate very quickly and visually the most active areas of the slope.
This work shows the enormous volume of valuable information on the behavior of linear infrastructures that InSAR technology is capable of generating.
This technology makes it possible to monitor tens of kilometers of linear infrastructure (including slopes and hillsides) at once, with a very positive impact on their management and preventive maintenance.
At Detektia we help you to continuously monitor embankments or other infrastructures. InSAR technology allows us to identify early any deformation in the ground surface.