- January 2019 - December 2023
- Ebro Valley, Zaragoza, Spain
- Ascending and Descending
- Sentinel-1
- Sinkholes
In this case study we analyze the activity of sinkholes in the evaporite karst of the Ebro Valley (Spain) in the period between 2019 and 2023. To carry out this work we start from a scientific paper published in 2015 in which this activity was analyzed until 2010. With the information available today from the Copernicus Program we study in depth the evolution of the deformation years later.
For the development of this case study, we are basing our analysis on a scientific paper published in 2015 that evaluates sinkhole activity using InSAR technology in the evaporite karst of the Ebro Valley: you can read it here.
This work uses SAR imagery up to the year 2010, specifically from three SAR missions: ERS-1 and ERS-2, Envisat, and ALOS PALSAR.
What makes this analysis interesting is that it is a historical assessment conducted before the Sentinel-1 mission. Today, we can easily analyze what has happened in the study area since 2015 thanks to the Copernicus Programme.
I found it relevant to assess the current state of the study area since 2019. By combining data from the EGMS project with Detektia’s tools, I have conducted an in-depth analysis of ground deformation evolution from 2019 to 2023.
Based on displacement detected in ascending and descending satellite geometry, I generated time series of vertical deformation and East-West planimetric movement.
The article defines the criteria that deformation must meet to be considered related to sinkhole activity. These include:
- Negative mean velocity rates exceeding the stability thresholds proposed. These thresholds are set between -2 and -4 mm/year depending on the SAR band used (C-band or L-band).
- Occurrence of at least three subsidence points within the area of an inventoried sinkhole. Given that we have significantly increased the spatial resolution of the InSAR output, this threshold may need to be raised.
- In large collapse sinkholes, ground motion values exhibiting a spatial pattern consistent with typical sinkhole subsidence (i.e., increasing subsidence rates toward the center of the depression).
It has been very straightforward to identify active sinkholes, assess their size, compare them with the locations and deformation rates reported in the scientific article, and analyze their evolution since 2019, identifying which sinkholes are accelerating or slowing down in terms of deformation.
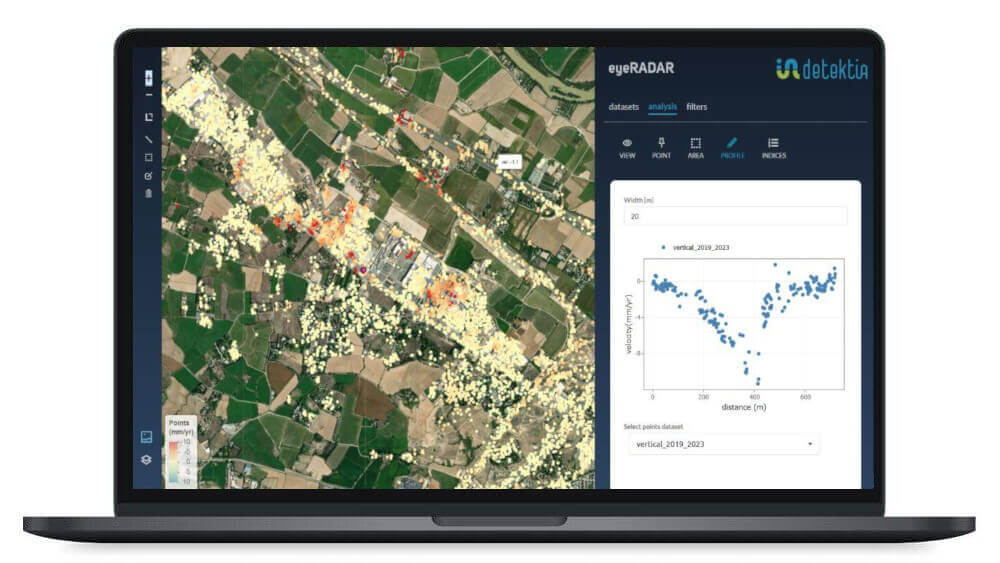
Deformation velocity profiles, such as the one in the figure below, allow us to accurately characterize the typical deformation pattern of this kind of phenomenon.
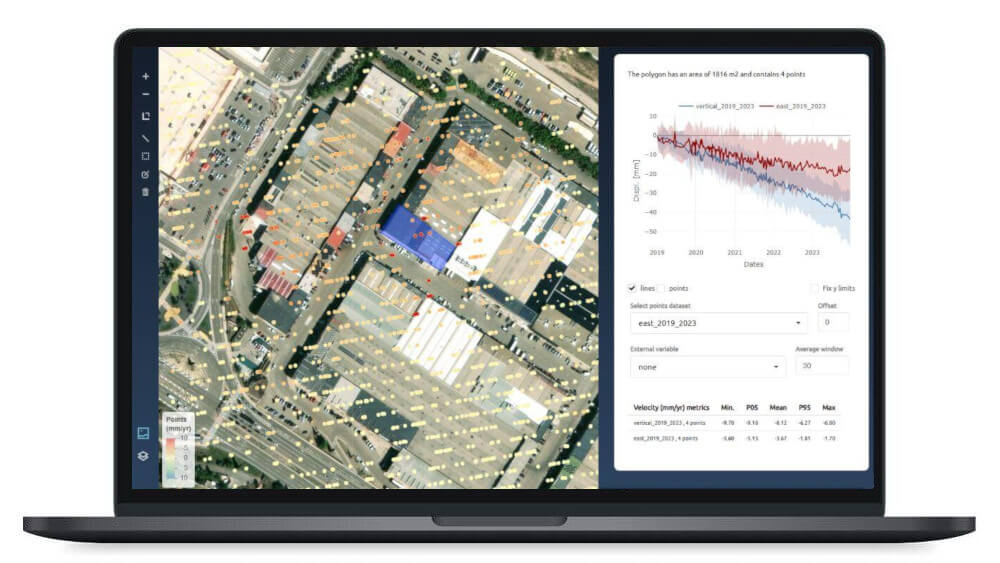
As seen in the figure below, it is also possible to calculate metrics that indicate the structural health of buildings located on top of active sinkholes.
By comparing the figures in the scientific article with those from our Sentinel-1 analysis, we can observe how much InSAR results have improved from 2010 to the present.
The spatial and temporal resolution of InSAR processing using Sentinel-1 data has significantly increased compared to results obtained in 2010 with missions such as ERS, Envisat, and ALOS PALSAR.
🛠️ This is yet another example showing that we are at a perfect time to fully leverage the power of open-access Sentinel-1 data in the civil engineering sector. We should not miss this opportunity.